Functions & Programming in R

From copy-paste to a reusable pipeline — WPM Summer School

Cosima Meyer · 2026

Who am I? 👋

👩🏼‍🎓 PhD in Political Science @ University of Mannheim

👩🏼‍💻 Transitioned into Data Science

💜 Founded RLadies+ Cologne · Former RLadies+ Global team member

Cosima Meyer

Before we dive in, here’s the material:


bit.ly/git-and-functions

What often happened to me

Where this comes from

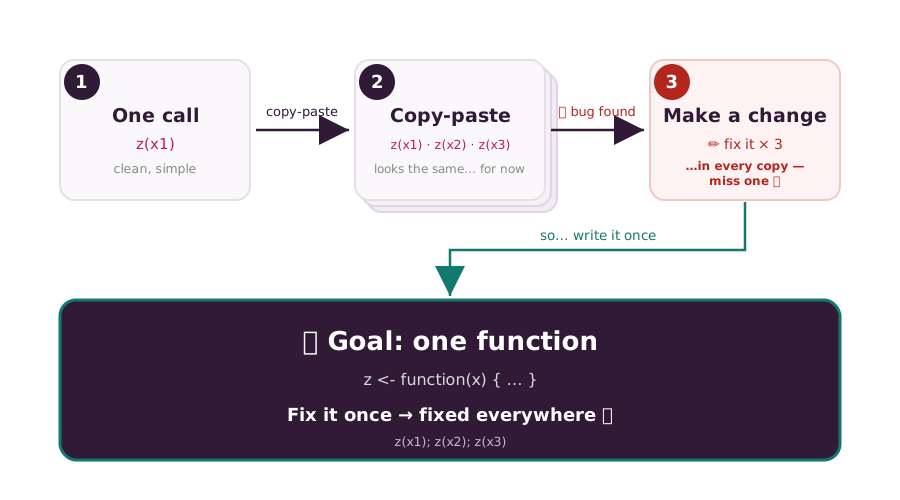
During my PhD I kept re-writing the same code every project: checking where the missing values were, building the same coverage tables, making the same plots.

One day I wrapped that into a function. Then another. Then another.

Those functions became {overviewR}, a package on CRAN.

Don’t Repeat Yourself (DRY)

Don’t

Repeat

Yourself

Fix it once → fixed everywhere

Before → after


Copy-paste

d1 <- (x1 - mean(x1)) / sd(x1)
d2 <- (x2 - mean(x2)) / sd(x2)
d3 <- (x3 - mean(x3)) / sd(x3)

# ...forgot na.rm here

One function 😌

z <- function(x) {
  (x - mean(x, na.rm = TRUE)) /
     sd(x, na.rm = TRUE)
}
z(x1); z(x2); z(x3)

One place to read, one place to fix.

What is a function?

A function is like a machine: you put something in, it does its work, something comes out.
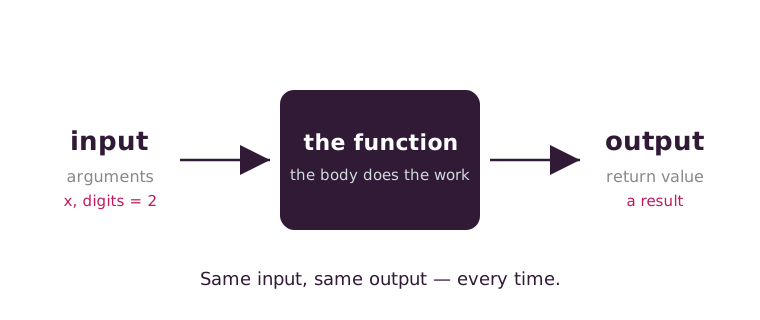
One function = one job.

This credo defines when to write a function, what to call it, and when to split it.

Now back to everyone


Think of a task that you repeat in every project.


Cleaning column names?


Plotting missing values for multiple data sets?


A simulation you re-run?


Something else?

Anatomy of a function

name · arguments · body

The skeleton

make_stats <- function(x, digits = 2) {

stats <- c(n = length(x), sd = sd(x))

return(round(stats, digits))

}

name a verb that does something

arguments the inputs, the nouns

body the steps, inside { }

return() what comes back out

Every function you will ever write is these blocks: name, arguments, body.

Live: make_sum()

make_sum <- function(x) {
  return(sum(x))
}

make_sum(c(2, 4, 6))   # 12

return(): explicit vs. implicit. R hands back the last value automatically, so sum(x) alone would work.

While you’re learning, write return() anyway. It makes your intent obvious.

Grow it: make_stats() 🌸

make_stats <- function(x, digits = 2) {
  stats <- c(
    n    = length(x),
    mean = mean(x, na.rm = TRUE),
    sd   = sd(x,   na.rm = TRUE)
  )
  round(stats, digits)        # last value = returned
}

make_stats(c(2, 4, 6))        # n=3, mean=4, sd=2

digits = 2 is a default argument, sensible out of the box but overridable when you need it, e.g. make_stats(x, digits = 0).

Exercise 1: Your first function

clean_colnames()

Exercise 1: Your first function

you have this 😰
Respondent ID Birth Year Q1 Response
1 1990 1) Yes
2 1985 2) No
3 2001 1) Yes

clean_colnames()

you want this 😌
respondent_id birth_year q1_response
1 1990 1) Yes
2 1985 2) No
3 2001 1) Yes

…and if you’re quick, those 1) prefixes go too. That’s the bonus 🧹

  1. Write clean_colnames(df) that, for every column name:
    1. lowercases it
    2. replaces spaces with underscores

Starter file: 2_exercises/01-clean-colnames/starter.R

Your toolkit (all base R, no packages):

names(df)          # get/set
tolower("HELLO")   # -> "hello"
gsub(" ", "_", x)  # " " -> "_"
10:00

What you just did

You just rewrote a real package function:

clean_colnames()janitor::clean_names()

library(janitor)
survey |> clean_names()

When it breaks 🐛

Before you reach for the debugger

  • Read the error message. R usually tells you what broke and where, so start there.
  • traceback(): the trail of calls that led to the crash (what called what).
  • print() / cat() inside the function: the quick “what’s the value right here?” check.

Watch your own function run

debug(clean_colnames)         # dig in
clean_colnames(survey)        # pauses inside, step through it
undebug(clean_colnames)       # climb back out

Inside the debugger, you’re standing in the function’s world:

Key Does
n run the next line
c continue to the end
s step into
f step out
Q quit out

Type names(df) while you’re paused: you can inspect anything the function can see.

Exercise 2: Debug it 🐛

Step inside the function you just wrote

Exercise 2: Debug it 🐛

Part 1: watch it work. Run debug() on your own clean_colnames(), call it on survey, and press n line by line. After each step, type names(df) and watch the names change.

Part 2: now find the bugs. 2_exercises/02-debugging/starter.R has two broken versions. Both look fine. Use the debugger to find out why they aren’t:

clean_colnames_bug1(survey)   # ...gives you nothing back?
clean_colnames_bug2(survey)   # ...runs, but the names are wrong
15:00

☕ Break

10:00

Building up, petal by petal 🌸

Start minimal. Add one petal at a time.

Your clean_colnames() from Exercise 1 can grow exactly this way.

A function blooms 🌸

  • the core: lowercase + _ for spaces
  • fail loudly: stopifnot(is.data.frame(df))
  • handle messier input: any punctuation, not just spaces
  • defensive, downstream: warn on duplicate names

A function blooms 🌸

  • the core: lowercase + _ for spaces
  • fail loudly: stopifnot(is.data.frame(df))
  • handle messier input: any punctuation, not just spaces
  • defensive, downstream: warn on duplicate names

A function blooms 🌸

  • the core: lowercase + _ for spaces
  • fail loudly: stopifnot(is.data.frame(df))
  • handle messier input: any punctuation, not just spaces
  • defensive, downstream: warn on duplicate names

A function blooms 🌸

  • the core: lowercase + _ for spaces
  • fail loudly: stopifnot(is.data.frame(df))
  • handle messier input: any punctuation, not just spaces
  • defensive, downstream: warn on duplicate names

Each petal was one small change

That’s how functions grow

Write defensively

Functions should fail loudly and early, not silently do the wrong thing.


clean_colnames <- function(df) {
  stopifnot("`df` must be a data frame" = is.data.frame(df))
  # ...
}
Tool When
stopifnot() a quick “this must be true or stop”
stop("msg") a hard error with your own message
warning("msg") keep going, but flag something suspicious

Naming & refactoring

  • Functions are verbs, arguments are nouns: clean_ucdp(dat, country)
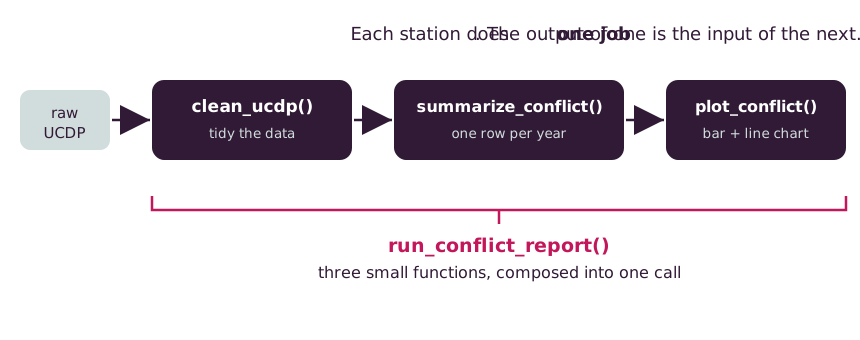
  • One function = one job. If you can’t name it in a short verb phrase, it’s probably doing two things
  • When a function gets long, split it into smaller named functions

Small, focused functions are easier to read, test, and reuse.

A modular pipeline

clean → summarize → plot → compose

Follow along in your own IDE. Run each step as it appears.

The scenario

You work with UCDP conflict event data. Every time a new country or period lands, you run the same three steps:

  1. clean the data
  2. summarize it (deaths & events per year)
  3. plot it

Today we turn that script into composable functions.

Data: subsample of UCDP GED v24.1, at 1_data/ucdp_ged_sample.csv (in the repo)

Step 1: clean_ucdp()

library(dplyr)
library(janitor)

clean_ucdp <- function(dat, country_filter = NULL) {
  stopifnot(is.data.frame(dat))
  out <- dat |>
    clean_names() |>         # the janitor trick from Exercise 1
    filter(!is.na(best)) |>  # drop events with no death estimate
    rename(deaths = best)
  return(out)
}


country_filter = NULL → by default keep every country; pass one to narrow. Named country_filter, not country, so it never collides with the data’s own country column. One job: hand back tidy data.

Step 2: summarize_conflict()

summarize_conflict <- function(dat) {
  dat |>
    group_by(year) |>
    summarise(
      total_deaths = sum(deaths),
      n_events     = n(),
      .groups = "drop"
    )
}

It takes Step 1’s tidy data in, and hands back one row per year.

Step 3: plot_conflict()

library(ggplot2)

plot_conflict <- function(dat, title = NULL) {
  ggplot(dat, aes(x = year, y = total_deaths)) +
    geom_col(fill = "#311a36") +
    labs(title = title, x = NULL, y = "Deaths")
}

It takes the table Step 2 produced and returns a chart.

Step 4: Bring them all together

run_conflict_report <- function(dat, country, title = NULL) {
  if (is.null(title)) title <- paste0("Conflict in ", country)
  dat |>
    clean_ucdp(country_filter = country) |>
    summarize_conflict() |>
    plot_conflict(title = title)
}

run_conflict_report(ged, country = "Iraq")

What you now have

Each function stands on its own: you can test or debug it without touching the rest of the pipeline.

It actually works
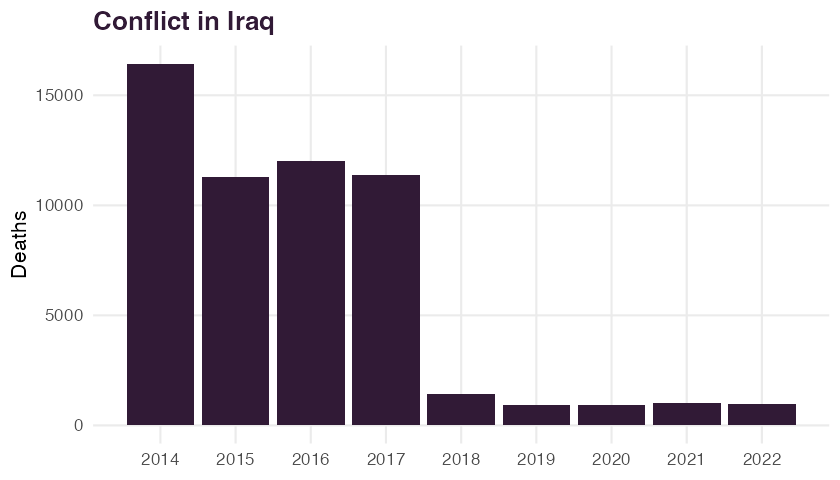
run_conflict_report(ged, country = "Iraq")

Sneak peek: Scale it with {purrr}

Once the work is a function, running it for every country is one line.
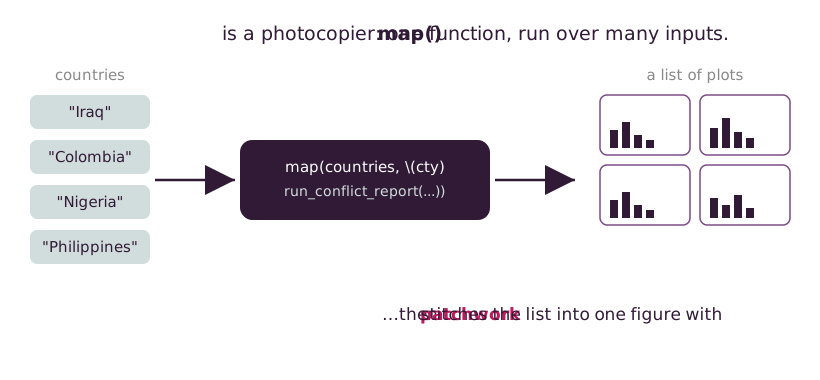
Sneak peek: Scale it with {purrr}
library(purrr)

countries <- c("Iraq", "Colombia", "Nigeria", "Philippines")

plots <- map(countries, \(cty) run_conflict_report(ged, country = cty))

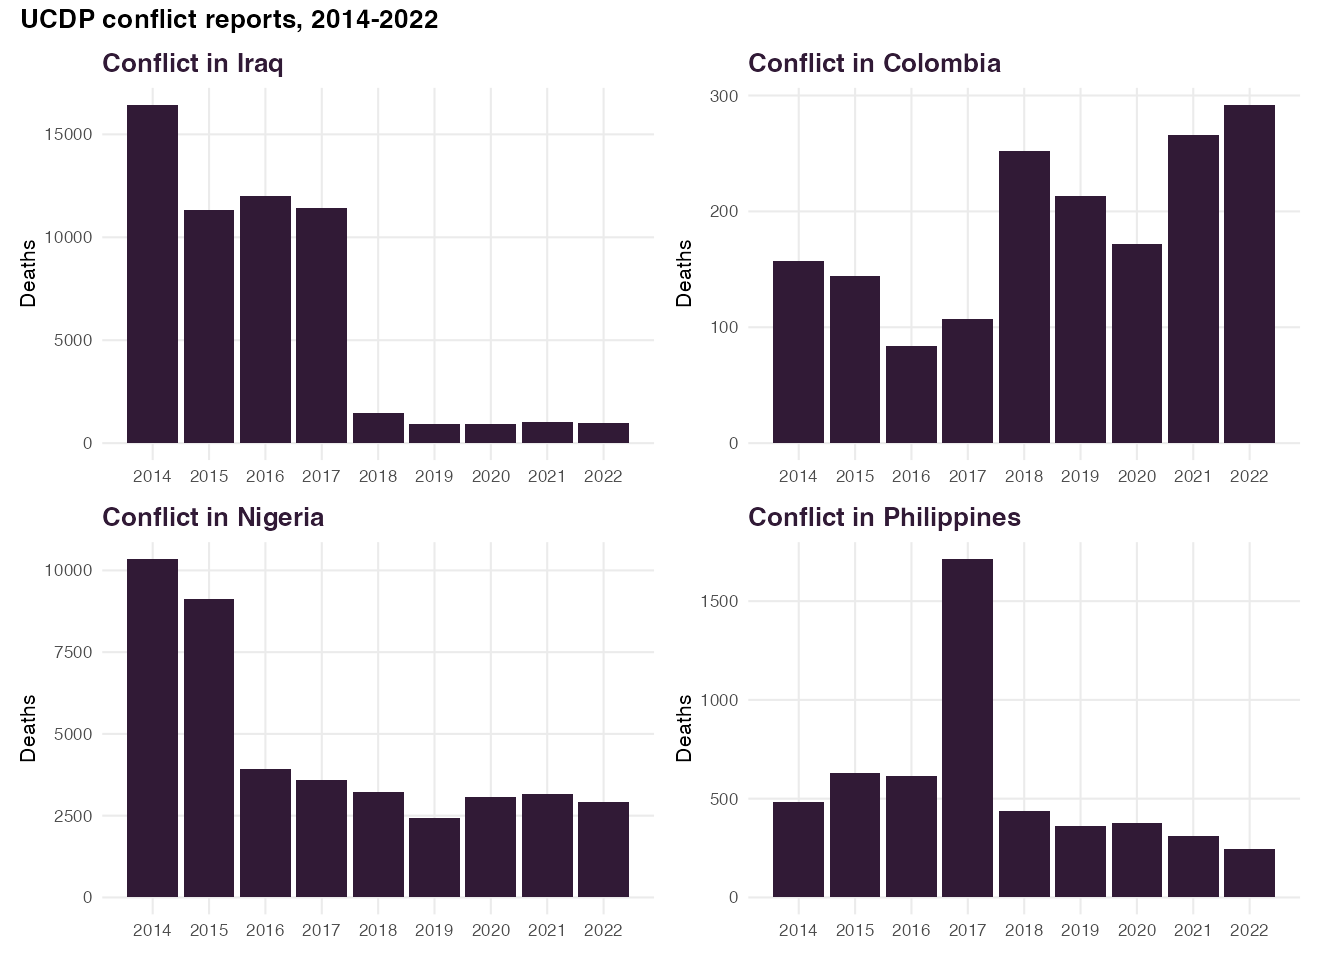
plots is now a list of four charts: one function, run four times, zero copy-paste.

Sneak peek: Scale it with {purrr}

{patchwork} stitched these four into one figure.

Exercise 3: Your own pipeline

Turn your repeated steps into composable functions

Exercise 3: Your own pipeline

Think of a sequence you repeat: clean something → transform/summarize it → visualise or export it, something you’d actually use.

🎯 Your task

  1. Sketch it in plain English first: steps in, steps out.
  2. Write at least two functions, one job each.
  3. Compose them into a pipeline with |>.

While you build

  • Start with one function that runs. Then add the next.
  • stopifnot() at the top of each: fail early.
  • Name each as a verb. Hard to name = doing too much.
  • Test each function on its own before composing.

🛟 Stuck? Start here

Grab a template from 2_exercises/03-your-pipeline/:

  • A: clean → summarize a data extract
  • B: simulate draws → summarize them
  • C: read many files → bind → export

Or extend today’s pipeline: write export_report(), saving the plot as a .png and the summary as a .csv, named from country, then fold it into run_conflict_report().

25:00

Wrap-up

one function debug it modular functions a pipeline git this afternoon packaging the future :)

Resources

Thank you

A fully bloomed flower

Appendix

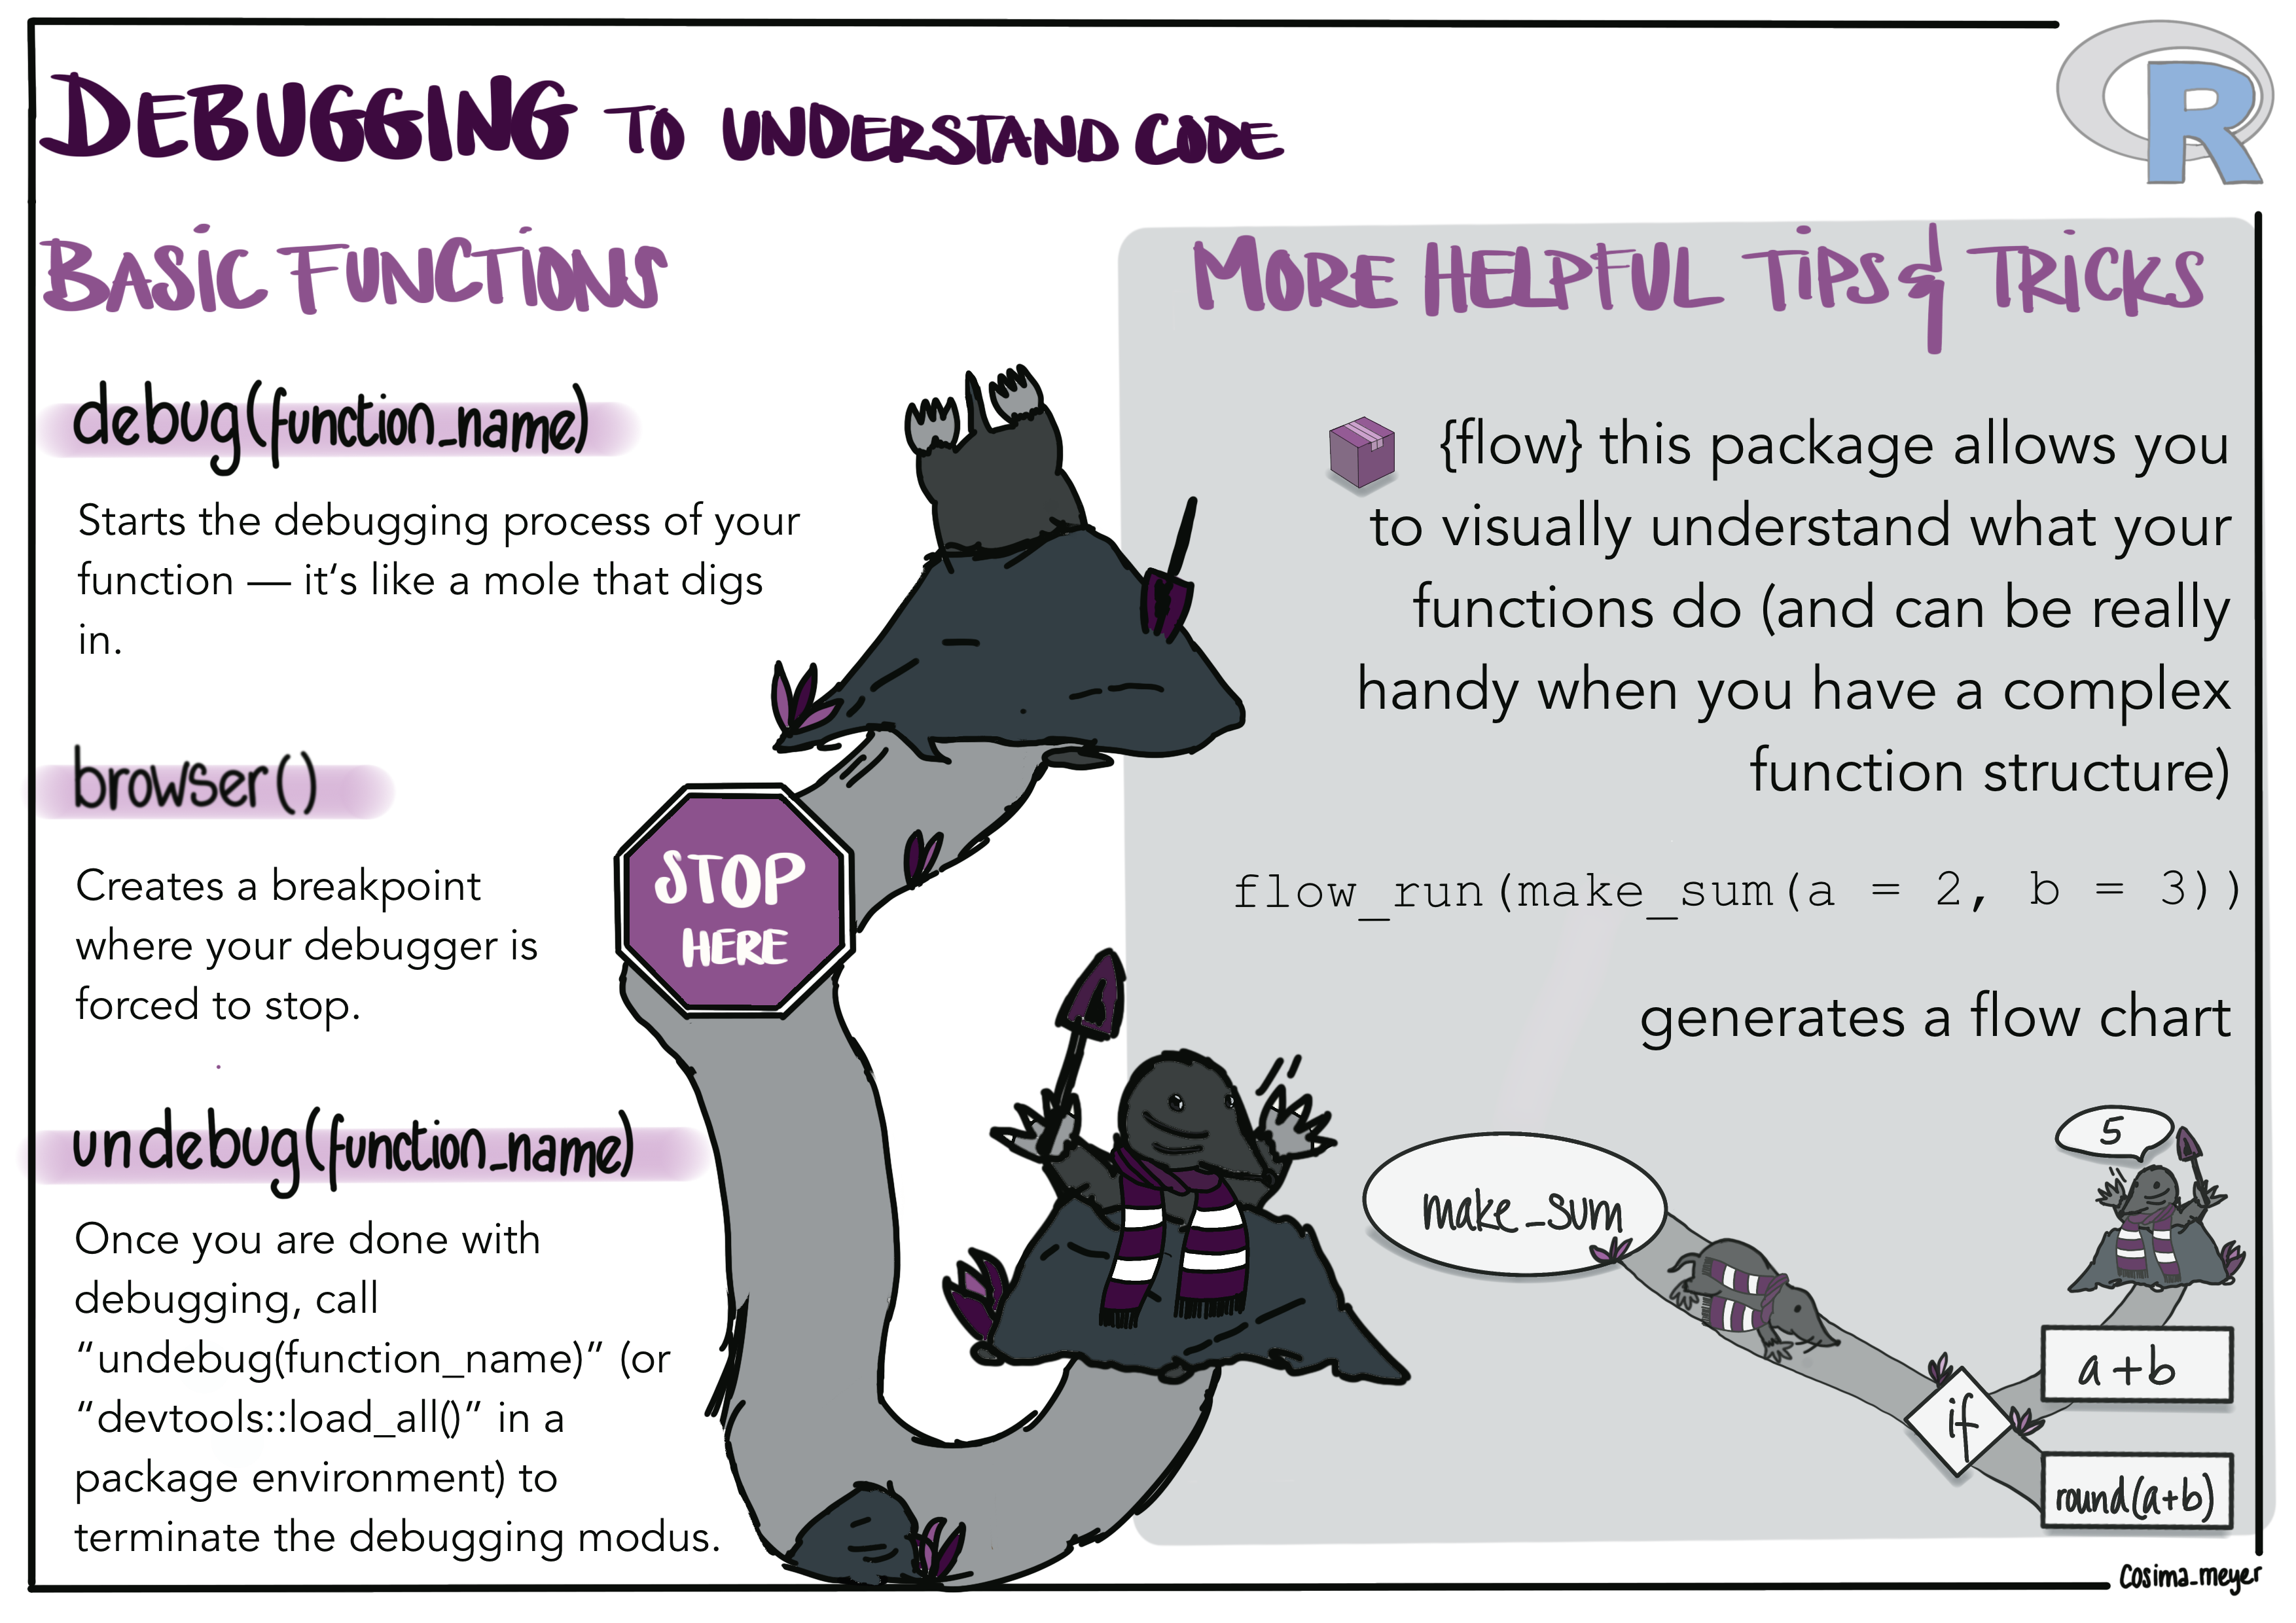
Debugging: follow the mole 🕳️

debug(f) digs into f and steps through it · browser() stops anywhere so you can look around · undebug(f) climbs back out · {flow} draws what a function does. (That’s make_sum() from earlier!)

Debugging a composed pipeline

run_conflict_report() calls three functions. When it breaks, which one broke?

traceback()                # what called what, start here

debug(clean_ucdp)          # suspect one function? dig into it
run_conflict_report(ged, country = "Iraq")
undebug(clean_ucdp)

Or drop a browser() inside the step you suspect, and run the whole pipeline:

summarize_conflict <- function(dat) {
  browser()                # stops here, mid-pipe, with `dat` in hand
  ...
}

Small functions make this easy: each one is a small place to look.

Two bits of modern R

Anonymous function (R 4.1+)

\(x) x + 1

# same as
function(x) x + 1

A throwaway function with no name.

The native pipe |>

c(2, 4, 6) |> make_stats()

# reads as: take the vector,
# THEN make_stats() it

You’ll also see the older %>% pipe from {magrittr}; same idea. We use |> since it’s built in.

Solutions

Exercise 1: A solution

clean_colnames <- function(df) {
  names(df) <- tolower(names(df))
  names(df) <- gsub(" ", "_", names(df))
  df
}
survey |> clean_colnames() |> head(2)
#>   respondent_id birth_year q1_response
#> 1             1       1990      1) Yes
#> 2             2       1985       2) No

Exercise 1: Bonus Solution

The headers are clean, but "1) Yes" is a label glued to a code. You want "Yes".

q1_response
1) Yes
2) No
1) Yes

clean_values()

clean_values <- function(x) {
  trimws(gsub("^[0-9]+[)]", "", x))   # drop a leading "1)", "2)", ...
}
survey$q1_response |> clean_values()   # "Yes" "No" "Yes"

Same three parts, a different job, so it’s a different function. One function = one job.

Exercise 2: Solution

  • Bug 1: the last line is an assignment, so the function hands back the column names, not the data frame, and invisibly — hence “nothing happened”.
  • Bug 2: the gsub() arguments are the wrong way round (gsub("_", " ", ...)), so the spaces are never replaced at all: you get "respondent id", not "respondent_id".

Full walkthrough: 3_solutions/debug_clean_colnames.R