This function plots a ggplot to visualize a cross table plot.
Usage
overview_crossplot(
  dat,
  id,
  time,
  cond1,
  cond2,
  threshold1,
  threshold2,
  xaxis = "Condition 1",
  yaxis = "Condition 2",
  label = FALSE,
  color = FALSE,
  dot_size = 2,
  fontsize = 2.5
)
Arguments
- dat
Your data set
- id
Your scope (e.g., country codes or individual IDs). If the id variable contains NAs, they will not be included in the plot.
- time
Your time (e.g., time periods given by years, months, ...)
- cond1
Variable that describes the first condition
- cond2
Variable that describes the second condition
- threshold1
A threshold for
cond1- threshold2
A threshold for
cond2- xaxis
Label of the x axis ("Condition 1" is default)
- yaxis
Label of the y axis ("Condition 2" is default)
- label
Label of the observations. Overlapping labels are avoided by using 'ggrepel'
- color
Color of the different observation groups
- dot_size
Option argument that defines the dot size (default is 2)
- fontsize
If label is TRUE, the fontsize arguments allows to define the text of the labels (the default is 2.5)
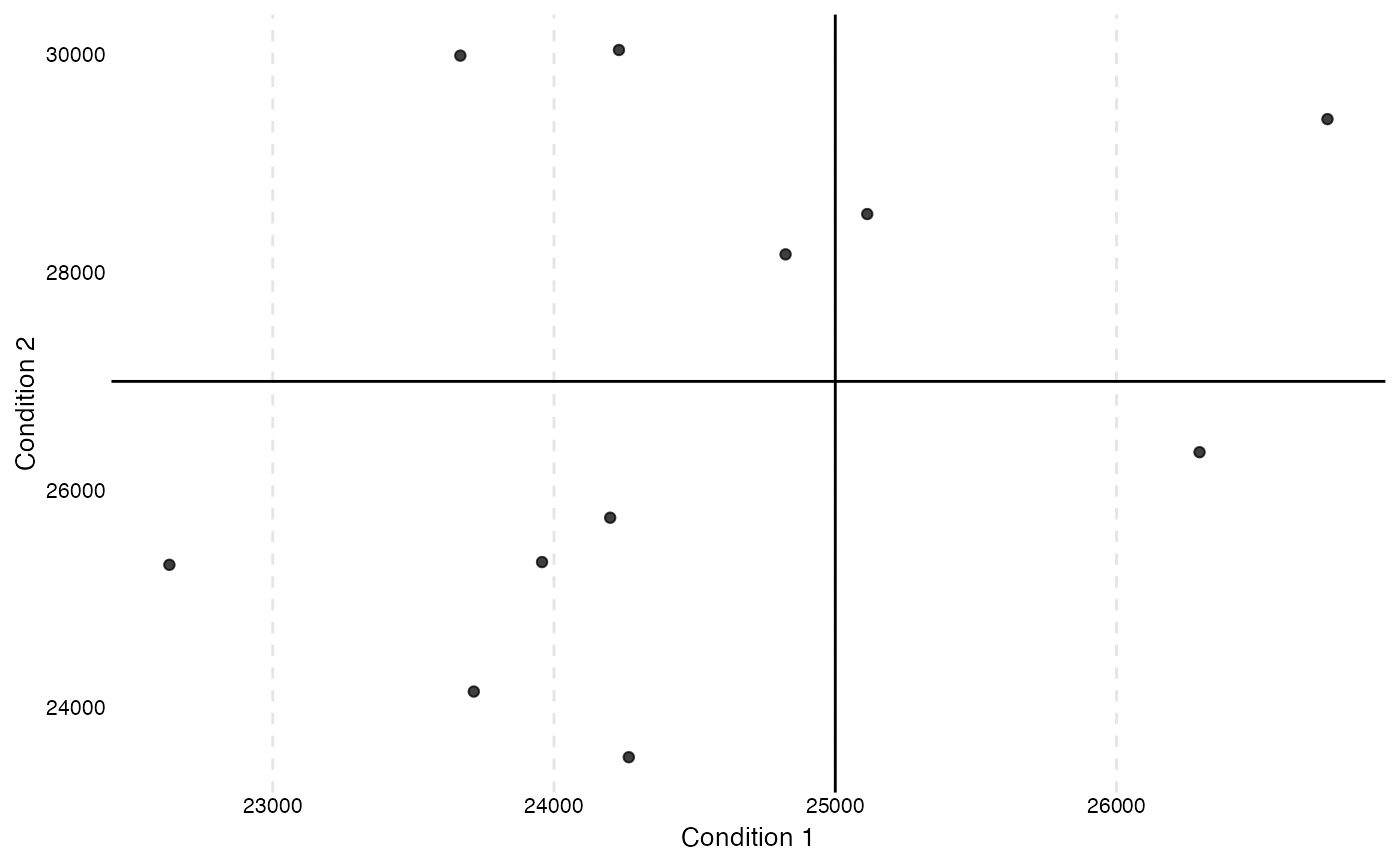
Examples
data(toydata)
overview_crossplot(
  dat = toydata,
  cond1 = gdp,
  cond2 = population,
  threshold1 = 25000,
  threshold2 = 27000,
  id = ccode,
  time = year
)